Pro V3 [SMRT Algo]SMRT Algo Suite is a versatile toolkit featuring advanced features designed to deliver valuable signals and insights, catering to every trader's technical analysis requirements with precise data.
The SMRT Algo V3 represents a groundbreaking, comprehensive solution built from the ground up for traders.
While SMRT Algo can complement other technical analysis methods, it is also designed to function effectively as a standalone indicator adaptable to any trading style. Each feature is designed with the understanding that not all technical indicators suit every market condition.
The optimal approach to leveraging this indicator is to explore its diverse features gradually, select a few that best match your trading style, and use them consistently to develop a personalized SMRT Algo strategy.
Features:
Buy & Sell Signals: Clear buy and sell signals displayed on the chart, with ‘+’ indicating strong signals and normal signals without ‘+’.
Candle Coloring: Blue and red candle colors to signify bullish and bearish trends, respectively.
Signal Sensitivity: Adjust the frequency of signals to match your trading preferences.
MA Filter: Customizable moving average filter to ensure trades align with the prevailing trend.
Dashboard: Multi-timeframe analysis with information on various timeframes, offering quick decision-making capabilities and a customizable dashboard size.
Trailing Stop Loss: Suggestions for trailing stop losses to maximize profits while minimizing risk.
Power MA: A custom moving average that closely follows price, highlighting short-term market trends.
ChoCh/Bos: Displays internal market structure, including changes of character and breaks of structure.
Market Structure: Shows external market structure, detailing changes of character, breaks of structure, and pivot points.
Support & Resistance: Key support and resistance zones plotted on the chart.
Reversals: Highlights areas with a high likelihood of reversal using diamond markers.
Reversal Bands: Zones where price is likely to reverse or correct.
Trend Lines: Auto-plotted trendlines for quick and easy analysis.
Retest Zones: Ideal for break-and-retest traders, identifying key retest zones for entries and re-entries
Take Profit & Stop Loss: Customizable take profit and stop loss points.
Full Any Alert() Function Call Conditions: Create custom alerts directly to your TradingView device for timely notifications.
Additional features: A set of toggles turning on/off these indicators.
SMRT Algo Pro V3 offers a comprehensive set of features designed to enhance your trading experience by providing actionable insights and customizable tools for all trading styles.
SMRT Algo Pro V3 Confirmation Signals and Candle Coloring
The signals in SMRT Algo Pro V3 can generate both normal and strong labels, with strong signals marked by the "+" symbol. These signals are closely linked to the candle coloring, providing a visual representation of trend development to help navigate various market conditions effectively.
Candle Coloring:
Blue Candles: Indicate bullish trends.
Red Candles: Indicate bearish trends.
Candles will turn blue when there is a buy signal, and turn red when there is a sell signal.
The candle coloring is especially useful when interpreting signals. For instance, a consistent series of blue candles alongside buy signals suggests a strong uptrend, reducing the likelihood of a fake-out. Conversely, a series of red candles with sell signals indicates a strong downtrend.
Dashboard for Multi-Timeframe Analysis
The dashboard provides a consolidated view of multiple timeframes, helping traders make quick decisions based on comprehensive data. This feature reduces the need to switch between charts, streamlining the analysis process.
The dashboard will show the trend of higher timeframes, based on signal calculation and the trend filter.
Note on the dashboard: To reduce memory load, it will only display information from the current timeframe and up.
Trailing Stop Loss
This component workw to maximize profits and manage risk. The Trailing Stop Loss feature provides dynamic stop loss levels. Traders can use this feature to place their stop loss in profit while price goes in favor of your direction, so that less profit is left on the table, should the trade reverse against you.
Green trailing stop loss ranges are shown for buy trades, while red lines are shown for sell trades. This can be used together with the buy & sell signals to trail the stop loss for those trades.
Power MA
The Power MA follows the price closely, indicating short-term market trends and potential exit points. Traders can use the Power MA to determine when to enter a trade. For example, if the Pro V3 prints a buy signal, but the power MA is red (indicating that the market is short term bearish), it can act as a confirmation to stay out of that trade. Conversely, if the power MA is blue, then it can be an added confirmation to enter the buy trade based on the signals.
Market Structure
The inclusion of ChoCh/Bos (Change of Character and Break of Structure) helps traders understand internal and external market shifts. The ChoCh/Bos shows internal market structure, while the Market Structure feature shows the external market structure. This feature is crucial for identifying key turning points and potential trend continuations, as well as ICT traders.
We recommend traders to use this as an added confirmation, for example, once a buy signal is printed, wait for an internal or external Choch/BOS, possibly indicating that the market is now in control of the bulls. From there traders an either enter off another signal from the V3 or wait for the retest from the Retest Zones feature of the V3.
Support & Resistance, Reversals, and Reversal Bands
These features highlight critical market levels and areas where price is likely to reverse or correct. They are essential for traders looking to capitalize on key support and resistance zones or potential reversal points.
They can be used together with the buy & sell signals. An example is when a sell signal appears, we can look for potential trade exits either at the S/R zones, the reversal diamonds that are printed on the candle, or when price touches the reversal bands.
Trend Lines
Auto-plotted trend lines and the trend ribbon provide insights into longer-term trends. They can be used together with the buy sell features of the V3, e.g. if a sell signal is printed, but price is in the lower half of the trend lines, we can assume that price is in an area of premium for our short trade. Traders can choose whether to wait for price to retrace back into an area of discount (top half of the trend line), where they can look to short.
Retest Zones
The Retest Zones feature identifies optimal entry and re-entry points for break-and-retest strategies. As mentioned earlier, this feature can be used together with other features to act as a re-entry or further confirmation before entering a trade.
Traders can wait for a signal to be printed by the V3, and wait for further confrirmation from the retest zones to enter at a better price. This feature can be used together with the signals, and the market structure features to create a simple break & retest strategy.
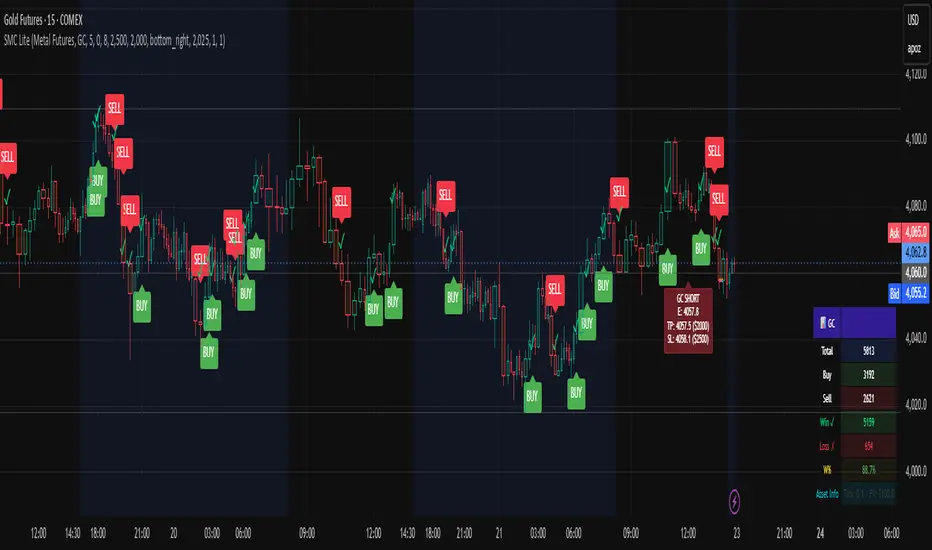
Take Profit Modes:
SMRT Algo Pro V3 includes a versatile Take Profit Mode designed to help traders optimize their exits:
Hybrid Mode: Displays Take Profit, entry, and stop loss lines on the chart for the current position. Additionally, small circles labeled TP1, TP2, and TP3 indicate the points where take profit levels were hit.
Minimal Mode: Only displays the small circles labeled TP1, TP2, and TP3, providing a cleaner chart view while still indicating take profit hits.
Traditional Mode Only: Displays only the lines for Take Profit, entry, and stop loss, without the small circles.
Take profits are based off of 1:1, 1:2 and 1:3 risk to reward ratio with respect to the stop loss.
These modes offer flexibility for traders to choose their preferred level of detail on the chart, helping them to manage their trades effectively and track their take profit levels clearly.
The features of SMRT Algo Pro V3 can significantly strengthen your market analysis by providing additional confluences. These features allow traders to cross-verify signals and trends, making their strategies more robust and reliable. Here's how you can leverage these features:
SMRT Algo Pro V3 offers a comprehensive suite of tools and features that extend beyond the capabilities of standard or open-source indicators, providing significant additional value to users.
Integrated System: Unlike basic or open-source tools that may require multiple installations and configurations, SMRT Algo Pro V3 combines all necessary indicators into a cohesive system.
Advanced Customization: The toolkit offers extensive customization options, including signal sensitivity adjustments, customizable MA Filters, and various Take Profit Modes. These features allow traders to tailor the system to their specific trading styles and risk tolerance, providing a level of personalization that free tools often lack.
Real-Time Market Adaptation: SMRT Algo Pro V3 includes features like a deep learning dashboard and real-time market data integration, which continuously update and adapt to changing market conditions. This ensures that users receive the most current and relevant signals, enhancing decision-making accuracy.
Educational Support: Alongside the tools, SMRT Algo provides comprehensive educational resources and tutorials, helping traders understand how to effectively use the system and develop robust trading strategies. This educational aspect adds significant value, especially for beginners looking to deepen their knowledge.
Comprehensive Analysis Tools: The inclusion of multi-timeframe analysis, a detailed dashboard, and advanced market structure indicators help traders make more informed decisions by offering a complete picture of market dynamics.
Support and Community: Subscribers to SMRT Algo Pro V3 gain access to dedicated 24/7 support and an active trading community. This support network can be invaluable for troubleshooting, strategy development, and gaining insights from other experienced traders.
SMRT Algo believe that there is no magic indicator that is able to print money. Indicator toolkits provide value via their convinience, adaptibility and uniqueness. Combining these items can help a trader make more educated; less messy, more planned trades and in turn hopefully help them succeed.
RISK DISCLAIMER
Trading involves significant risk, and most day traders lose money. All content, tools, scripts, articles, and educational materials provided by SMRT Algo are intended solely for informational and educational purposes. Past performance is not indicative of future results. Always conduct your own research and consult with a licensed financial advisor before making any trading decisions.
Pine Script®指標